On the eve of a new year, we are meant to reflect on all that we accomplished (and didn’t) and put forward our hopes and goals for the new year. I find this hard to do as I get older because time seems so warped, and change is hard to measure. When I reflect back to 2023 to see what has changed for me, I am left with blurry memories and vague recollections, much like the three years of living during the pandemic. But there were some bright spots and standout moments.
Our last New Year’s Eve was spent crisscrossing most of Italy, ending in the heel, also known as Puglia (where my family is from), with the idea that we wouldn’t return for a long while. Not that we don’t love Italy, but we spent almost six years living there, and maybe it is time to see other places if we do decide to travel. I had just learned I was granted tenure at Columbia University and would join the new Climate School faculty in July of 2023. Exciting. Now comes the hard part – we had to sell our house and downsize our belongings to snuggly fit into a smaller Columbia-subsidized apartment in NYC. Offloading a house in the middle of a housing crisis with high interest rates is stressful and borderline nightmarish, but we managed to do it. Plus, moving just sucks. No matter how often you do it (and for us, we are at 25 times), it is just a massive hassle. So, the first half of 2023 was one significant stressball transition phase.
Things fell into place once we got to NY in June. We live in the Upper West Side, where I have worked for a long time and where we have lived before, so it all seems routine and familiar. Are we too comfortable and normalized? God forbid that we get too comfortable. It may be time to move to another borough and start another walkabout MaPhattan project. Brooklyn beckons, but the ever-evolving NYC landscape is unpredictable, and it is hard to know where to move that won’t become overly gentrified or where you are not participating in such a predictable path.
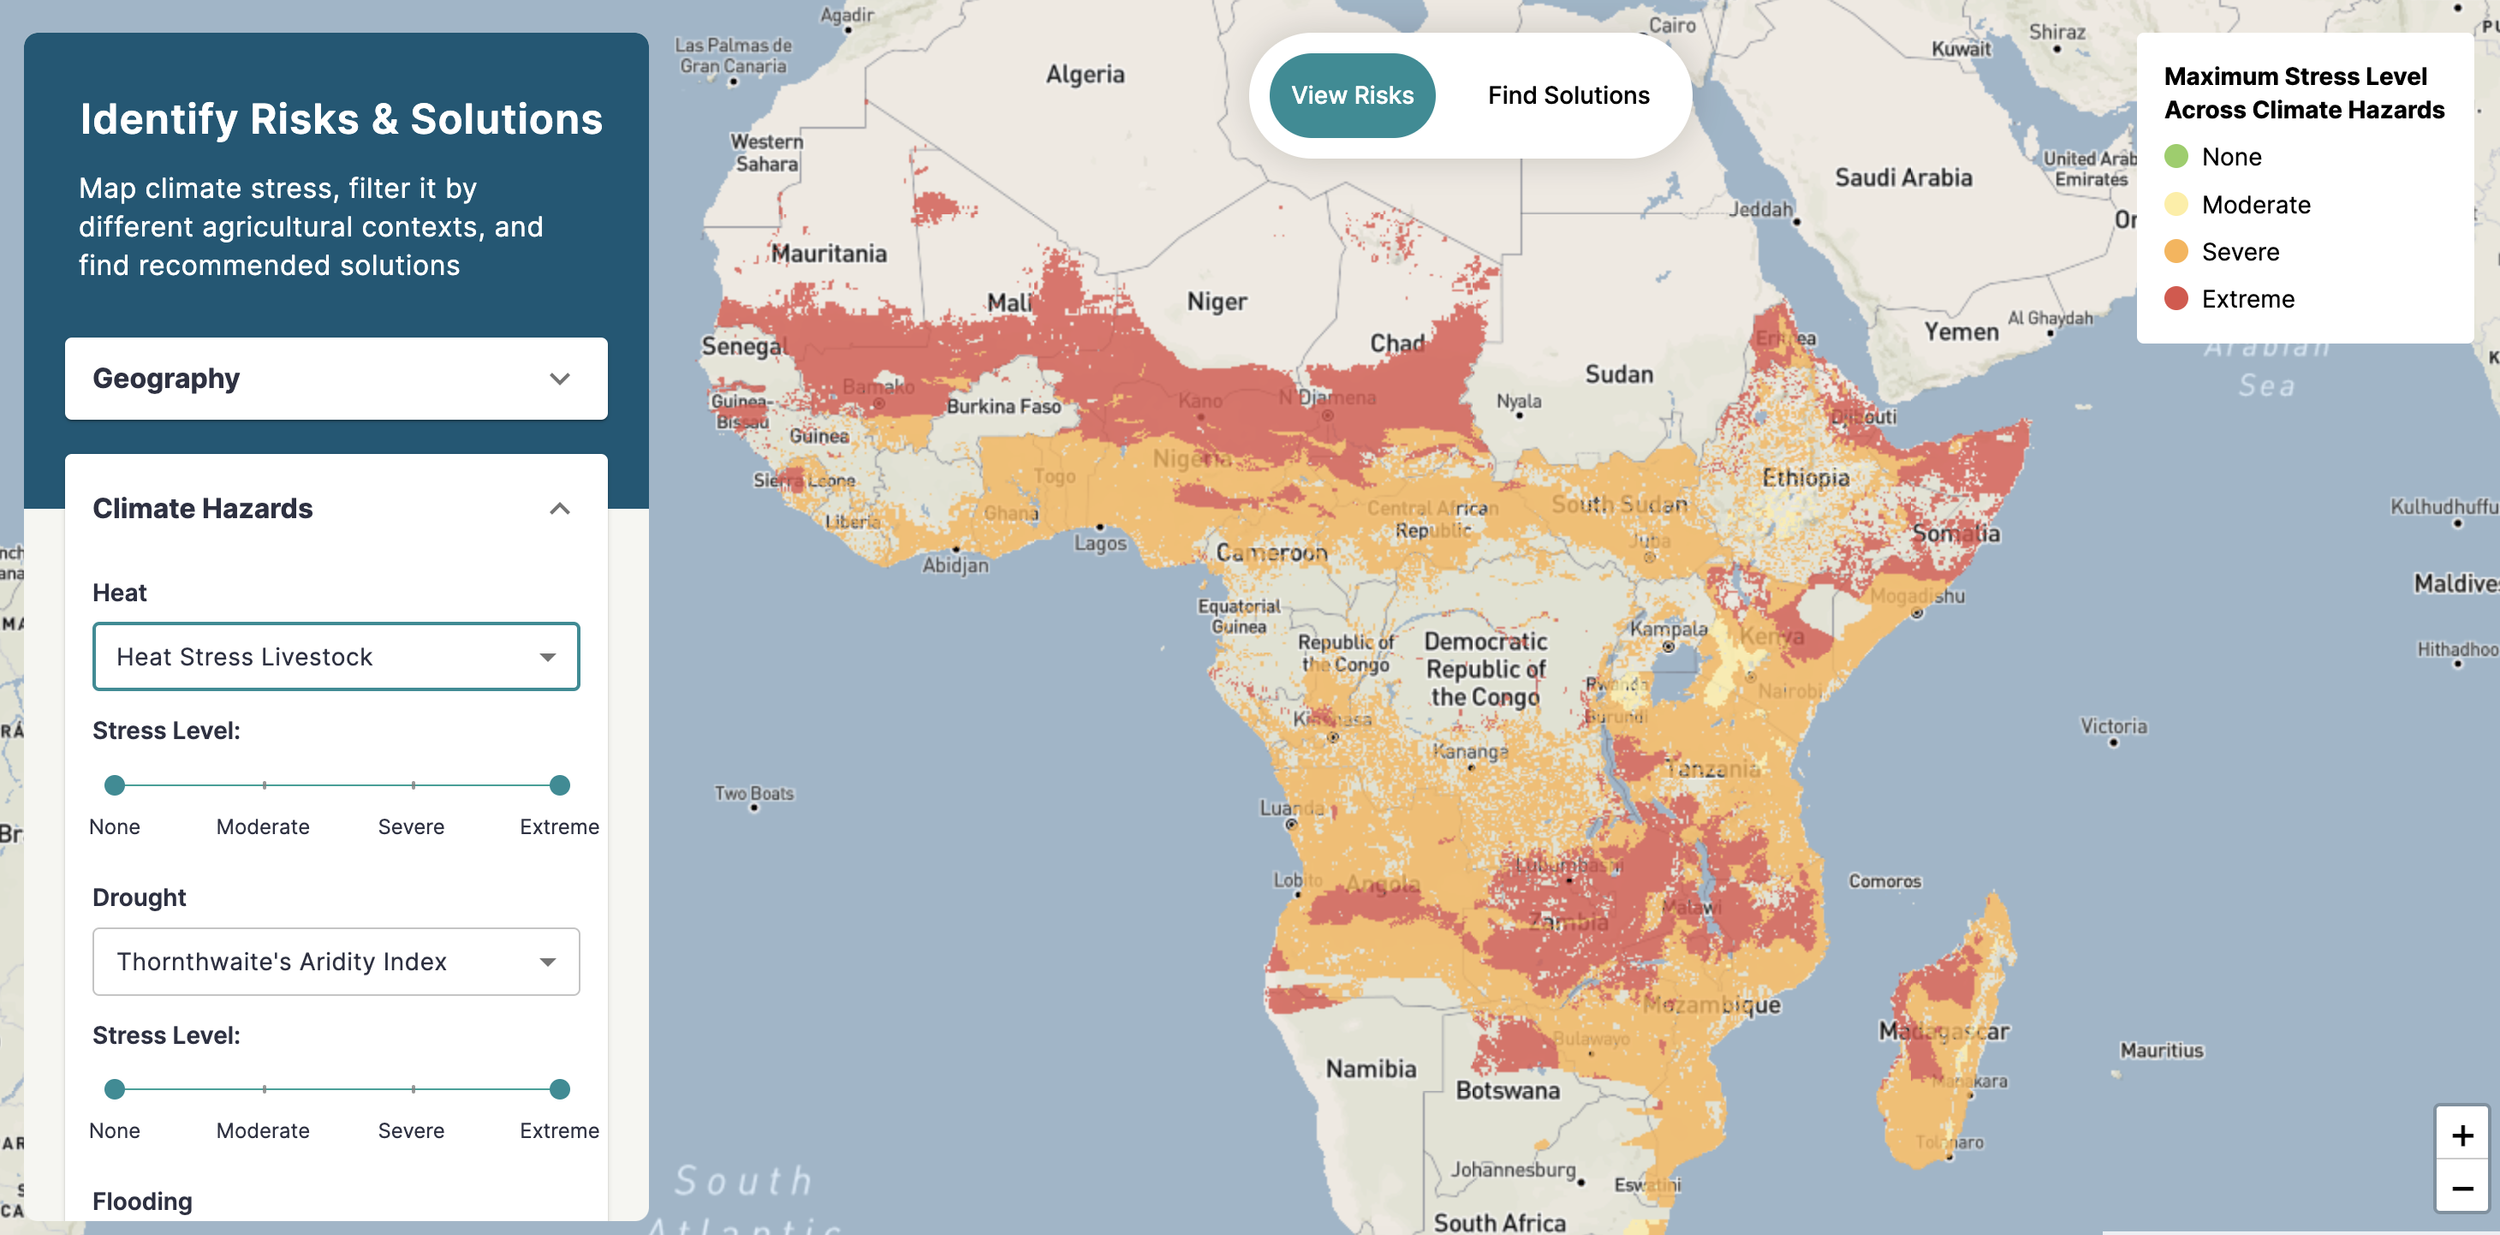
On the work front, I published, in collaboration with many stellar scientists, 18 papers, the final one being the Food Systems Countdown Initiative paper and report. I started a new job as a Professor of Climate and Food at Columbia’s Climate School and as the Interim Director of the International Research Institute of Climate and Society. It has been an interesting adjustment since leaving Hopkins, with a lot of my team going on to spread their wings in other institutions. The Food Systems Dashboard is going strong along with other various projects.
On a personal note, we, the Sound Furies, finished our fifth album, Times Edit. My favorite song is Mandelbrot’s Coastline. I traveled a hell of a lot less and will continue on that path in 2024. What I will do in 2024 is spend some time curating and sharing all the photos I have taken on my 60+ country travels. 2023 was filled with ordinary experiences — I got COVID, which sucked. I walked an average of 5.8 miles per day, up from last year, which was 5.2 miles. I tried out the Peleton (there is one in my building) and found it ridiculous but effective. I ate red meat maybe five times and tried my best only to take public transport (maybe got in a taxi/uber 4-5 times) if walking wasn’t an option. I continue to bake sourdough…I decided I like folk music (maybe it’s my age) and succulents (maybe it’s my age). We celebrated our 27th wedding anniversary. I turned 52. We ate in 55 restaurants since arriving in NYC (hey, don’t give me shit, I’m in the food business).
Looking to 2024, the new year brings the opportunity to turn over a new leaf, improve, and make a change. But change is ruthlessly tough, and we are often hard on ourselves when we don’t make those changes “successfully.” And I must admit, I am worried about the changes to come. The poem, What they did yesterday afternoon, by Warsan Shire has been running through my head:
“later that night
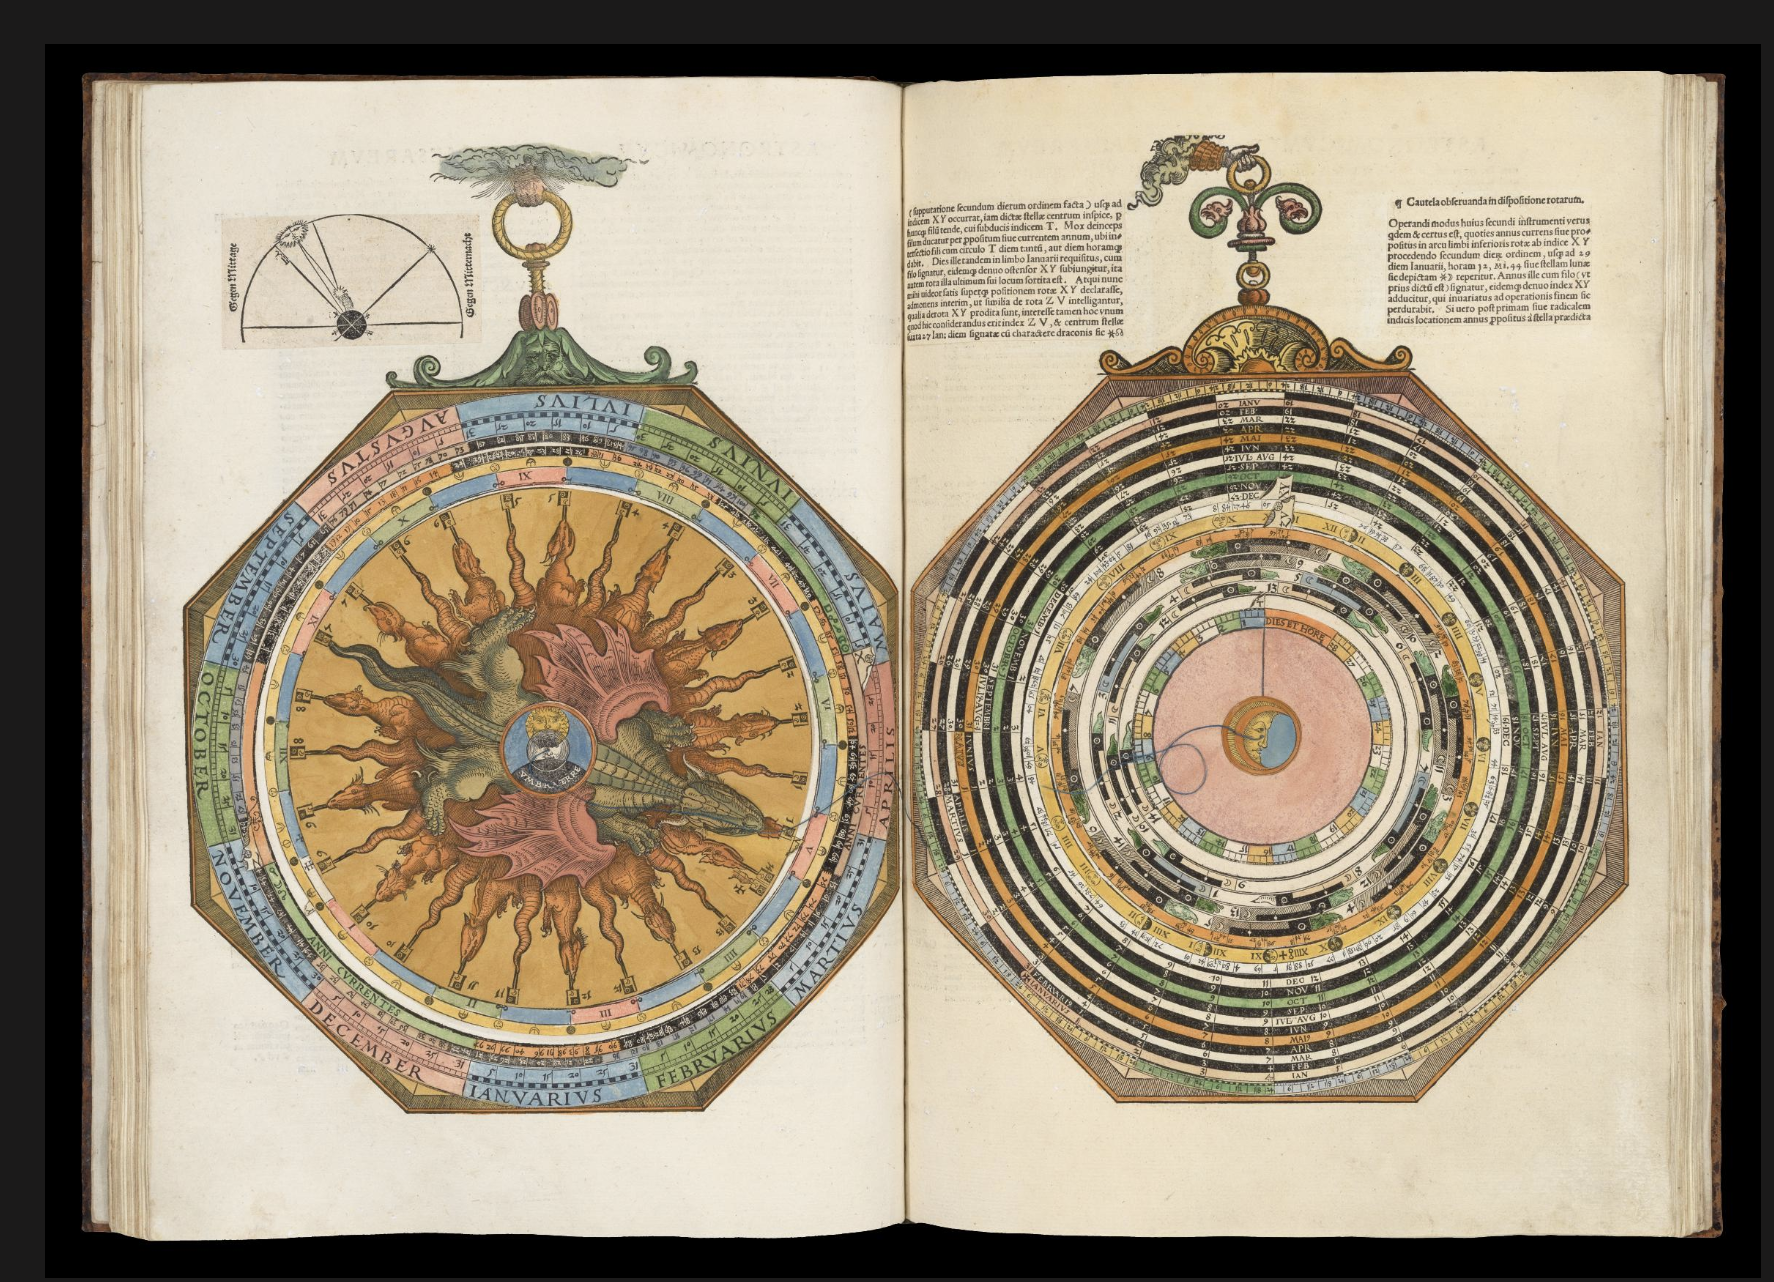
i held an atlas in my lap
ran my fingers across the whole world
and whispered
where does it hurt?
it answered
everywhere
everywhere
everywhere.”
Almost half of the world will be voting for new leaders in 2024, and democracy looks pretty fragile to me. I worry about the U.S. elections, as I am sure almost every American does, and the results will impact future decisions about our lives and goals. I am also profoundly concerned about the lack of action on mitigating climate change, what that will mean for everyone, particularly the poorest and most vulnerable, how much they will need to adapt, and with what resources.
But as the late Sam Cooke beautifully sang, a change is gonna come – the question is, are we ready for whatever comes? Because things don’t always change for the better, but they do change. Rebecca Solnit, author of Hope in the Dark, wrote, "Incremental change can happen quietly, and change is rarely straightforward. Victories slip by unheralded while failures are more readily detected.” I will remain hopeful in 2024 as I run my fingers across the world. I am going to remain hopeful. Not because I think everything is going to be okay. But hope for the possibility that the change that is coming pushes us forward to a more sustainable future.